
Chelsea xG Betting Analysis and Odds Insights
 Available in US
The beautiful game has never been more quantified than it is today. Walk into any pub during a Premier League match and you’ll hear punters throwing around terms like “expected goals” as casually as they once discussed formations. For those betting on Chelsea, understanding xG isn’t just academic exercise – it’s the difference between spotting value and throwing money at inflated odds. The Blues have become a fascinating case study in the gap between expected and actual output, creating opportunities that sharp bettors can exploit throughout the season.
Expected goals models have revolutionized how we evaluate football performance. Rather than simply counting goals scored, xG calculates the probability that any given shot results in a goal based on historical data from tens of thousands of similar attempts. A tap-in from three yards might carry an xG of 0.92, while a speculative effort from 30 yards could register just 0.02. When you aggregate these values across a match or season, you get a picture of what *should* have happened rather than what actually did. This distinction matters enormously for betting purposes because bookmakers price markets based on actual results, which often lag behind underlying performance.
Chelsea’s recent seasons have provided a masterclass in xG variance. During the 2024-25 campaign, the club generated approximately 68.66 expected goals in the Premier League while finishing with Cole Palmer as the standout performer converting chances at rates that defy mathematical expectation. The team’s xG against (xGA) has been particularly impressive when playing away from home, registering around 1.23 expected goals conceded per match – among the best figures in the league. These numbers tell a story that final scorelines sometimes obscure, revealing defensive solidity that betting markets occasionally undervalue.
Table of Contents
The Mechanics of xG-Based Betting
Understanding how to translate xG data into betting advantage requires grasping where the market creates pricing inefficiencies. When a team consistently outperforms its xG, you’re looking at either exceptional finishing, a clinical penalty taker like Cole Palmer, or simple variance that will eventually regress. Conversely, when actual goals fall short of expected output, the market often overcorrects, offering value on attacking lines that probability suggests should hit.
The regression principle sits at the heart of xG betting strategy. Football operates within statistical norms over sufficient sample sizes, meaning teams that significantly outperform or underperform their xG tend to move back toward equilibrium. If Chelsea generates 2.3 xG per match but only scores 1.5 goals over a ten-match stretch, the smart money anticipates increased goal output in subsequent fixtures. Bookmakers set lines based on recent form, creating windows where xG-informed bettors can find edges. The key is patience – regression happens over months, not matches, and chasing it game-by-game leads to frustration.
Defensive xG proves equally valuable for Chelsea betting. The Blues have demonstrated periods of remarkable defensive efficiency, with xGA figures suggesting they should concede fewer goals than actual results sometimes indicate. When assessing clean sheet probability or under goals markets, comparing Chelsea’s xGA against their actual goals conceded reveals whether defensive value exists. A team conceding 1.3 goals per match but posting xGA of 0.9 suggests either goalkeeper underperformance, set-piece vulnerability, or simple bad luck – all factors that typically correct over time.
Player-level xG adds another dimension to the analysis. Cole Palmer’s shot profile, for instance, reveals the quality of chances he receives and creates. His exceptional penalty conversion record – having scored 12 consecutive Premier League spot-kicks before finally missing against Leicester in March 2025 – demonstrates how individual finishing ability can skew team-level xG versus actual goals. When assessing Palmer’s goalscorer odds, understanding his xG per shot versus actual conversion rates helps identify whether current odds reflect sustainable performance or temporary deviation.
Identifying Regression Candidates
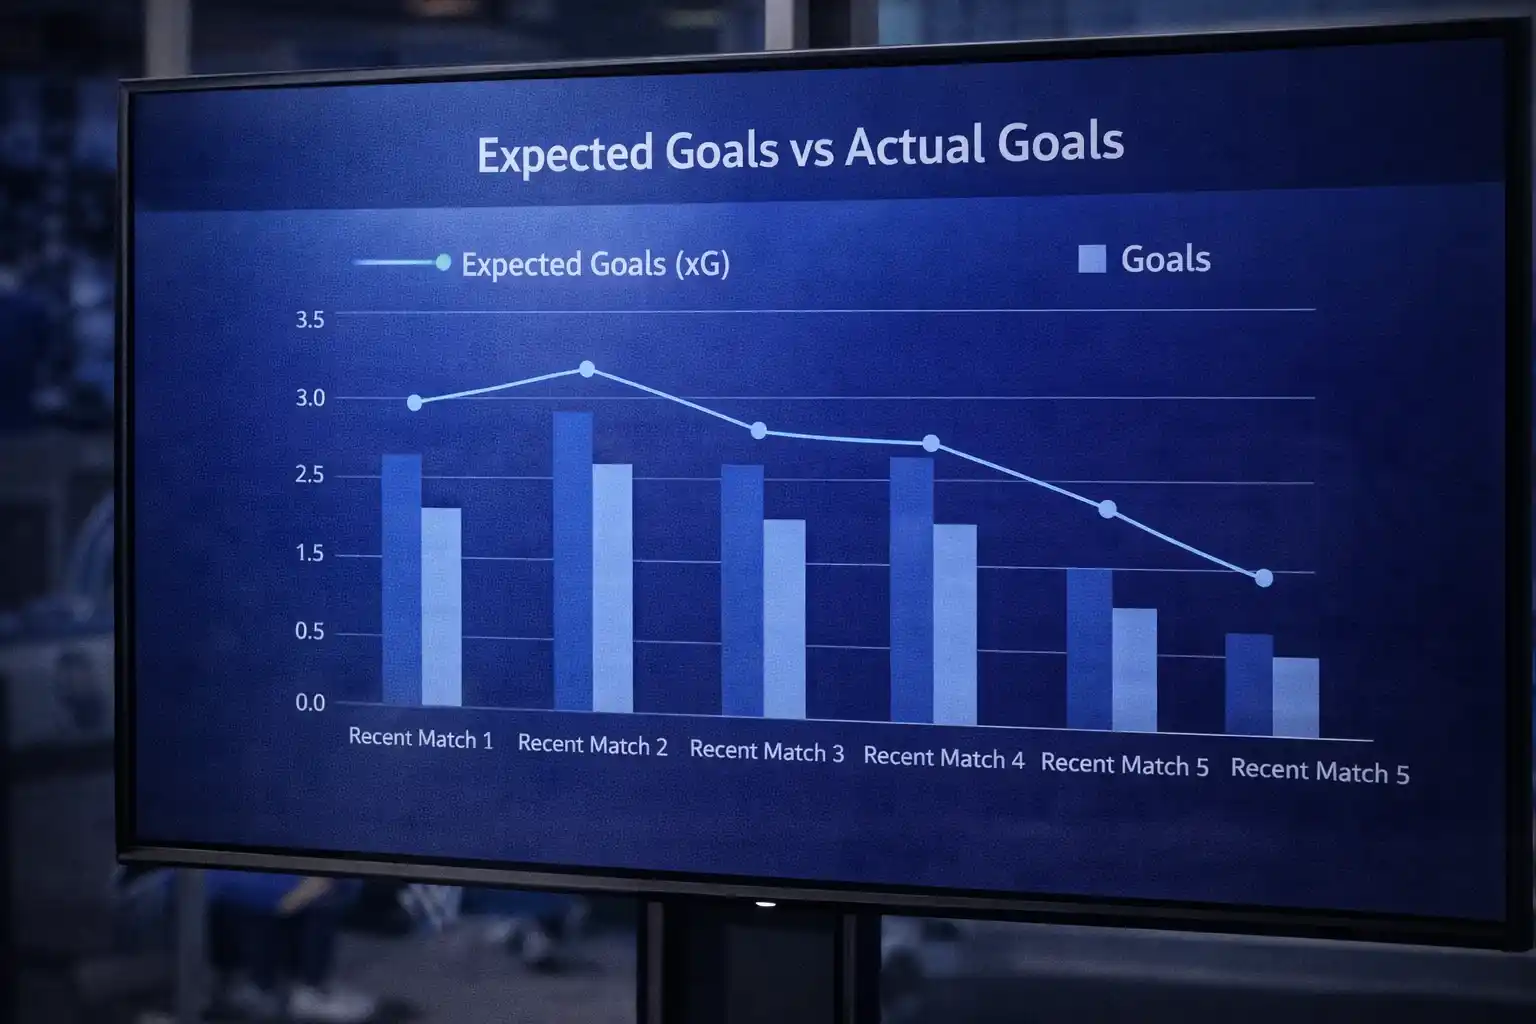
The practical application of xG betting requires systematic identification of regression scenarios. Chelsea matches present these opportunities regularly, particularly following runs of form that diverge significantly from underlying metrics. A four-match winless streak accompanied by strong xG generation signals buying opportunity rather than form crisis. Conversely, a winning run built on xG of 0.8 per match suggests vulnerability that betting markets may not fully price.
Home versus away splits offer fertile ground for xG analysis. Chelsea’s Stamford Bridge performances often show different xG profiles than away fixtures, and understanding these patterns enables more precise betting. The 2024-25 data showed Chelsea generating solid attacking numbers regardless of venue, but defensive xG varied more dramatically. Smart bettors segment their xG analysis by location, recognizing that a team’s xG footprint at home may not translate directly to road matches.
Opposition quality adjustments represent the final piece of the regression puzzle. Chelsea’s xG against Burnley holds different implications than identical numbers against Manchester City. Advanced bettors weight their xG calculations by opponent strength, recognizing that generating 2.0 xG against a relegation candidate differs fundamentally from the same output against title contenders. When Chelsea faces weaker opposition following a run against top-six clubs, the market often underestimates their potential output, creating over goals value that xG analysis identifies.
Practical xG Betting Applications
Match betting applications for xG center on identifying mispriced totals markets. When Chelsea’s rolling five-match xG significantly exceeds or falls short of actual goals, the over/under markets for their upcoming fixtures present opportunities. A team generating 2.4 xG per match but scoring only 1.6 goals is due for positive regression – their attack is creating chances, and assuming conversion returns to normal, over markets become attractive.
The both teams to score (BTTS) market responds particularly well to xG analysis. Chelsea’s xG against combined with opponent xG predictions helps estimate the likelihood of both teams finding the net. If Chelsea’s defensive xG suggests they should concede in approximately 55% of matches but actual data shows 70% BTTS rate, the market may overvalue BTTS:Yes. Understanding these xG-reality gaps allows bettors to fade popular trends when underlying numbers suggest the trend lacks statistical foundation.
Asian handicap betting benefits enormously from xG application. When the bookmaker sets Chelsea -1.5 against a mid-table opponent, comparing Chelsea’s average xG against that opponent’s typical xGA reveals whether the line offers value. If Chelsea generates 1.9 xG per match and the opponent concedes 1.7 xGA, the mathematical expectation suggests Chelsea should average 1.8 goals – making -1.5 a marginal proposition requiring careful consideration of variance.
First-half versus second-half xG splits provide additional betting angles. Chelsea, like most teams, shows different xG patterns across match halves. Some managers set up cautiously before unleashing attacking substitutions; others start aggressively before protecting leads. Tracking Chelsea’s half-by-half xG trends informs first-half goals betting, halftime result markets, and exact score propositions in ways that aggregate xG figures cannot.
Building Your xG Betting Framework

Successful xG betting requires consistent methodology applied across multiple matches. Start by establishing Chelsea’s rolling xG baseline – typically calculated over their last 10-15 matches to balance recency with sample size stability. Compare this baseline against upcoming opponent xGA figures to estimate expected goals for the fixture. Then identify where bookmaker pricing deviates from your xG-derived expectations.
Data sources matter considerably. Understat, FBref, and specialist providers offer varying xG calculations based on different underlying models. Opta’s expected goals differ from StatsBomb’s calculations, and these differences compound over seasons. Choose a primary source and stick with it, ensuring your comparative analysis uses consistent methodology. Switching between xG providers introduces noise that undermines analytical precision.
Bankroll allocation for xG betting should reflect the probabilistic nature of regression. Individual matches rarely provide definitive xG-based opportunities because sample sizes are too small. Instead, identify xG value across multiple Chelsea fixtures and spread stakes accordingly. A four-match sequence where Chelsea’s xG suggests over 2.5 goals value is more reliable than loading up on a single match where the deviation seems particularly stark.
Finally, track your xG betting results rigorously. Record your estimated probabilities, the bookmaker odds, and outcomes for every xG-informed wager. Over time, this ledger reveals whether your xG application actually identifies value or merely feels analytically sophisticated. The numbers don’t lie, and neither does your profit-and-loss statement. Sharp xG bettors understand that the model serves decision-making rather than replacing it – and the P&L remains the ultimate arbiter of analytical utility.
After learning how expected goals can sharpen Chelsea betting decisions and improve the reading of underlying match quality, readers can return to chelseabetexpert to continue building a more data-driven betting approach.
If someone wants to support xG-based reading with a more general team-level contextual article, the strongest next destination is Chelsea form analysis for betting.